Random BSoDs and reboots, KMODE_EXCEPTION_NOT_HANDLED

sooyong49

Member
Joined
Feb 3, 2024
Posts
11
Hi, currently my build is having some kind of random BSoDs and reboots, and sometimes my machine will locks up with stuttering sound.

Some information:
  • A brief description of your problem
    • System reboots and BSoDs at random, KMODE_EXCEPTION_NOT_HANDLED
    • Tried reinstalling AMD chipset drivers, but to no avail
  • System Manufacturer?
    • Self built
  • Laptop or Desktop?
    • Desktop
  • Exact model number (if laptop, check label on bottom)
    • Self built
  • OS ? (Windows 11, 10, 8.1, 8, 7, Vista)
    • Windows 10
  • x86 (32bit) or x64 (64bit)?
    • 64 bit
  • (Only for Vista, Windows 7) Service pack?
    • N/A
  • What was original installed OS on system?
    • Windows 10
  • Is the OS an OEM version (came pre-installed on system) or full retail version (YOU purchased it from retailer)?
    • Retail
  • Age of system? (hardware)
    • 4 years+
  • Age of OS installation?
    • 4 years +
  • Have you re-installed the OS?
    • No
  • CPU
    • Ryzen 5 3600
  • RAM (brand, EXACT model, what slots are you using?)
    • 2x8GB G Skill Ripjaws V 3000CL16 (slot 2 and 3, F4-3000C16-8GVRB)
  • Video Card
    • Sapphire RX 5700 XT Pulse
  • MotherBoard - (if NOT a laptop)
    • ASRock B450M Steel Legend
  • Power Supply - brand & wattage (if laptop, skip this one)
    • Seasonic G-550 80+ Gold
  • Is driver verifierenabled or disabled?
    • No
  • What security software are you using? (Firewall, antivirus, antimalware, antispyware, and so forth)
    • Nothing, except Windows Defender
  • Are you using proxy, vpn, ipfilters or similar software?
    • No
  • Are you using Disk Image tools? (like daemon tools, alcohol 52% or 120%, virtual CloneDrive, roxio software)
    • No
  • Are you currently under/overclocking? Are there overclocking software installed on your system?
    • Yes, XMP
I have attached the dump file and file collection zip.
 

Attachments

Hello, and welcome to the forum!

Taking all five dumps in the upload together, there is a strong indication that this is a hardware problem and most likely RAM. The bugcheck codes are different in each BSOD, the operation that was in progress is different, and, more importantly, there are no third-party drivers referenced in any of the dumps. That's a strong indication that this is most probably a hardware problem. In addition, some of the dumps fail with 0xC000005 exceptions (invalid memory reference) in Microsoft functions. Another fails with a 0xC000001D exception code (invalid opcode) caused by a misaligned instruction pointer. One dump has a check image failure, indicating a corruption in an executable image (win32kfull.exe)...
Code:
CHKIMG_EXTENSION: !chkimg -lo 50 -d !win32kfull
    fffff09deb14d630-fffff09deb14d65d  46 bytes - win32kfull!xxxMNCanClose+e0
    [ a0 48 8b 45 a0 ff 40 08:40 55 53 56 57 41 54 41 ]
    fffff09deb14d66a-fffff09deb14d672  9 bytes - win32kfull!xxxMNCanClose+11a (+0x3a)
 
    ......

    fffff09deb21decf-fffff09deb21dedf  17 bytes - win32kfull!GreRectangle+3f3 (+0x32)
    [ 00 00 66 0f 6e 44 24 68:48 8b 44 24 78 49 8b cf ]
WARNING: !chkimg output was truncated to 50 lines. Invoke !chkimg without '-lo [num_lines]' to view  entire output.
    fffff09deb45674a-fffff09deb45674b  2 bytes - win32kfull!TraceLoggingRegisterEx_EtwRegister_EtwSetInformation+82
    [ c2 88:32 94 ]
    fffff09deb4567c7-fffff09deb4567c8  2 bytes - win32kfull!CreateTlgAggregateSession+5f (+0x7d)
    [ f5 e4:75 f2 ]
    fffff09deb456eda-fffff09deb456edb  2 bytes - win32kfull!PlaySoundPostMessage+9de (+0x713)
    [ b2 21:62 25 ]
2354 errors : !win32kfull (fffff09deb14d630-fffff09deb456edb)

I would suggest that firstly you should test your RAM thoroughly...
  1. Download Memtest86 (free), use the imageUSB.exe tool extracted from the download to make a bootable USB drive containing Memtest86 (1GB is plenty big enough). Do this on a different PC if you can, because you can't fully trust yours at the moment.
  2. Then boot that USB drive on your PC, Memtest86 will start running as soon as it boots.
  3. If no errors have been found after the four iterations of the 13 different tests that the free version does, then restart Memtest86 and do another four iterations. Even a single bit error is a failure.

Let us know how that goes.
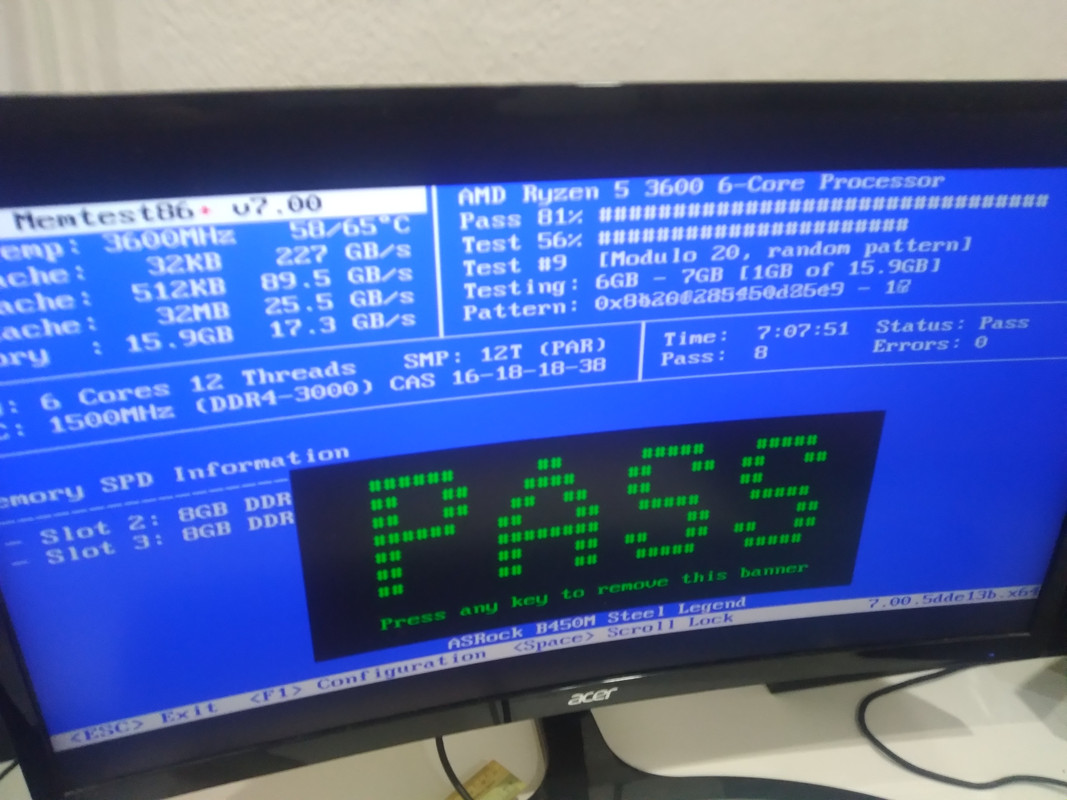
Already did a memory test, seems like no issues:

20240205-055712.jpg

I also did a BIOS update to the latest beta version, as the current version is very old (it doesn't support Ryzen 5000 CPUs). Please guide me further on this.
 
Now I'm confused. The SysnativeBSODCollection App upload you did shows your CPU as...
Code:
Processor    AMD Ryzen 5 3600 6-Core Processor, 3593 Mhz, 6 Core(s), 12 Logical Processor(s)
All of the data in the SysnativeBSODCollectionApp upload is for this CPU, but now you're saying that you have a Ryzen 5000 CPU? It's impossible for anyone to troubleshoot a system if you change the hardware in such a radical way. All the troubleshooting data we were working with is now useless.

  • What is the exact model of CPU you have now fitted?
  • Is the CPU on the QVL for the motherboard?
  • What version of the BIOS did you flash?
  • From where did you source the BIOS update?
  • Were there any power supply issues during the BIOS update?
  • Did the BIOS update process complete normally?
I mean, prior to the BIOS update I'm running a BIOS that is so old that it doesn't even support Ryzen 5000 CPUs. I am still running on a Ryzen 5 3600.

To answer your questions:
1. Ryzen 5 3600
2. No
3. 10.08 (beta)
4. ASRock B450M Steel Legend
5. No
6. Yes
 
Ah, now I see what you're saying.
  • Was the original BIOS the one that came with the motherboard?
  • It's a four-year old system, so were there any problems in the earlier years?
  • What changed just before you started getting these BSOD problems?
  • I am concerned that your CPU is not on the QVL for the board. That 10.08 BIOS includes updated AGESA support (AMD microcode) and I wonder whether that may not be compatible with your CPU? You might just have been fortunate that the AGESA version in the old (original?) BIOS did work with your CPU?
  • Is it possible to re-flash the original BIOS version?
Hardware is not my strongest area of expertise and this isn't really a BSOD problem right now. You might want to open a thread on the hardware forum with a link to this one so that people can see how you got here. The contributors on there will be much better able to get your system booting again. Once it's booting, if you then get BSODs do come back on here - with a new SysnatyiveBSODCollection App output.
1. Can't figure it out anymore, since I build the machine quite some time ago
2. No
3. I did clean my PC for dust, so I probably think I might have knocked some parts/cables off causing improper contact. I may try to reseat them when I have the free time
4. Yes, the new BIOS seem to support my CPU just fine
5. I may try, but so far looks like there is no BSoDs, may monitor and open a thread at hardware if things persist.
 
OK. It's always suspicious if you start getting BSODs after cleaning the insides. Reseating all cards and checking all cables - at both ends - would be wise.

Let us know how you get on.
 
OK. It's always suspicious if you start getting BSODs after cleaning the insides. Reseating all cards and checking all cables - at both ends - would be wise.

Let us know how you get on.
It turns out one of my GPU fans is not spinning (probably explains why the machine is so quiet), so I reseated their PCIe power cables and the system appears to be running normally, but now I got this BSoD instead:
 

Attachments

That's an unusual bugcheck. What were you doing at the time of the BSOD? Can you also please upload the kernel dump? It's the file C:\Windows\Memory.dmp and it will be large.

The process in control at the time was steamwebhelper.exe, so that may be at fault, although you can't trust that the process in the minidump was the one that caused the BSOD. What seems to have happened is that a user-mode thread has called a system service that may not be entirely valid. In the call stack we see the user mode call (from address 0x00007ffd`340cd064) which raises the IRQL of the processor, because we're now in kernel-mode, and the very next function call is a system service exit. Because we're running (still) at a raised IRQL and we're now returning to user-mode we get the 0x4A BSOD...
Code:
4: kd> knL
 # Child-SP          RetAddr               Call Site
00 ffff9908`a3a379b8 fffff800`78611aa9     nt!KeBugCheckEx
01 ffff9908`a3a379c0 fffff800`78611951     nt!KiBugCheckDispatch+0x69
02 ffff9908`a3a37b00 00007ffd`340cd064     nt!KiSystemServiceExitPico+0x34d          <========== and we immediately see a system service exit call
03 00000005`df5ff758 00000000`00000000     0x00007ffd`340cd064                         <========== here's the system call from user-mode

The kernel dump may well contain more information, minidumps only contain status for the thread that failed.

Can you also please upload another SysnativeBSODCollectionApp output? It's ALWAYS important to run that with every new BSOD.
 
Last edited:
Already turned off XMP, but I still get another BSoD (IRQL_NOT_LESS_OR_EQUAL, no dump files) - leaning towards a failing CPU...
 
That bugchek is most commonly caused by a flaky third-party driver. It happens when you take a page fault whilst running at an elevated IRQL, usually because a third-party driver has fouled-up a memory pointer. However, without a dump we can't really tell. You have been writing dumps but it's it's important to ensure that your system is properly configured to write dumps, so check that all of the following are true...
  • The page file must be on the same drive as your operating system
  • Set page file to "system managed"
  • Set system crash/recovery options to "Automatic memory dump"
  • Windows Error Reporting (WER) system service should be set to MANUAL
  • User account control must be running
In addition, the following can also prevent you seeing dumps...
  • SSD drives with older firmware do not create dumps (update the drive firmware)
  • Cleaner applications like Ccleaner delete dump files, so don't run them until you are fixed
  • Bad RAM may prevent the data from being saved and written to a file on reboot, so if all else fails test your RAM
Can you please run the SysnativeBSODCollectionApp again and upload the output. There may well be useful clues in the other data that's collected. In addition, check the timestamp on the file C:\Windows\Memory.dmp, if it relates to that 0xA BSOD (the IRQL_NOT_LESS_OR_EQUAL) then please upload it (it will be large). Also look in the folder C:\Windows\LiveKernelReports, you will probably see several sub-folders. Look through all sub-folders and upload any dump files that you find. These are live kernel dumps that are taken when a problem happens but from which Windows is able to recover.
 
Now I disabled processor C states and switched power supply idle to typical current idle in the BIOS - hopefully this should fix the issue
 
That might be a wise move. The most recent BSOID was a 0x139 KERNEL_SECURITY_CHECK_FAILURE which indicates a corruption of a critical kernel data structure. In your dump the argument 1 value 0f 0x21 indicates that an invalid exception chain was encountered, which is not terribly helpful. The exception record however, indicates that this was a FAST_FAIL_INVALID_IDLE_STATE.
Code:
EXCEPTION_RECORD:  ffffef80f2141408 -- (.exr 0xffffef80f2141408)
ExceptionAddress: fffff8007ae31340 (nt!KiSearchForNewThreadOnProcessor+0x00000000001ef870)
   ExceptionCode: c0000409 (Security check failure or stack buffer overrun)
  ExceptionFlags: 00000001
NumberParameters: 1
   Parameter[0]: 0000000000000021
Subcode: 0x21 FAST_FAIL_INVALID_IDLE_STATE
In the call stack (which you read from the bottom up) we can see cleanup happening after the completion of an I/O operation. Then we see the nt!KiSwapThread function cal to select another thread to dispatch. This is followed by a nt!KiSearchForNewThreadOnProcessor call and that's where we get the bugcheck.
Code:
4: kd> knL
 # Child-SP          RetAddr               Call Site
00 ffffef80`f2141188 fffff800`7ae11aa9     nt!KeBugCheckEx
01 ffffef80`f2141190 fffff800`7ae12010     nt!KiBugCheckDispatch+0x69
02 ffffef80`f21412d0 fffff800`7ae0ff9d     nt!KiFastFailDispatch+0xd0
03 ffffef80`f21414b0 fffff800`7ae31340     nt!KiRaiseSecurityCheckFailure+0x31d
04 ffffef80`f2141640 fffff800`7ac4141c     nt!KiSearchForNewThreadOnProcessor+0x1ef870
05 ffffef80`f21416c0 fffff800`7ac4085f     nt!KiSwapThread+0x5ec
06 ffffef80`f2141770 fffff800`7ac17e43     nt!KiCommitThreadWait+0x14f
07 ffffef80`f2141810 fffff800`7ac17878     nt!KeRemoveQueueEx+0x263
08 ffffef80`f21418b0 fffff800`7b0e829d     nt!IoRemoveIoCompletion+0x98
09 ffffef80`f21419e0 fffff800`7ae11238     nt!NtRemoveIoCompletion+0x13d
0a ffffef80`f2141a90 00007ffc`0f6ed104     nt!KiSystemServiceCopyEnd+0x28
0b 00000079`a23ff6f8 00000000`00000000     0x00007ffc`0f6ed104
This BSOD happened as the fast-fail suggests whilst the processor was effectively idle and looking for work. I think that disabling C-States is an excellent workaround to see whether this was the problem. I've seen AMD CPUs before that were (or became) unstable at lower power states and disabling C-States usually solves the problem at the cost of a bit more power drain and a bit more heat.

One other unrelated thing I have noticed in your System log are thee two error, one after the other...
Code:
Log Name:      System
Source:        Service Control Manager
Date:          09/02/2024 04:33:24
Event ID:      7031
Task Category: None
Level:         Error
Keywords:      Classic
User:          N/A
Computer:      DESKTOP-P95B6ID
Description:
The Microsoft Defender Antivirus Service service terminated unexpectedly. It has done this 1 time(s). The following corrective action will be taken in 1000 milliseconds: Restart the service.


Log Name:      System
Source:        Service Control Manager
Date:          09/02/2024 04:32:07
Event ID:      7000
Task Category: None
Level:         Error
Keywords:      Classic
User:          N/A
Computer:      DESKTOP-P95B6ID
Description:
The eapihdrv service failed to start due to the following error:
This driver has been blocked from loading
The eapihdrv.sys driver is part of the ESET Security product. It looks from this that you may have ESET antivirus and Windows Defender antivirus both running at the same time? That's a known problem, you only ever want one real-time antivirus engine running.
 
It looks like nt!KiSearchForNewThreadOnProcessor checks the IdleState field in KPRCB and then throws this exception if the result of doing a bitwise AND is 1.

Rich (BB code):
4: kd> !stack -p
Call Stack : 12 frames
## Stack-Pointer    Return-Address   Call-Site       
00 ffffef80f2141188 fffff8007ae11aa9 nt!KeBugCheckEx+0 
    Parameter[0] = 0000000000000139
    Parameter[1] = 0000000000000021
    Parameter[2] = ffffef80f21414b0
    Parameter[3] = ffffef80f2141408
01 ffffef80f2141190 fffff8007ae12010 nt!KiBugCheckDispatch+69 
    Parameter[0] = 0000000000000139
    Parameter[1] = (unknown)       
    Parameter[2] = ffffef80f21414b0
    Parameter[3] = (unknown)       
02 ffffef80f21412d0 fffff8007ae0ff9d nt!KiFastFailDispatch+d0 
    Parameter[0] = 00000000c0000409
    Parameter[1] = 0000000000000001
    Parameter[2] = fffff8007ae31340
    Parameter[3] = 0000000000000021
03 ffffef80f21414b0 fffff8007ae31340 nt!KiRaiseSecurityCheckFailure+31d 
    Parameter[0] = 0000000000000021
    Parameter[1] = 0000000000000000
    Parameter[2] = 0000000000000007
    Parameter[3] = ffff8c0cf900e158
04 ffffef80f2141640 fffff8007ac4141c nt!KiSearchForNewThreadOnProcessor+1ef870 (perf)
    Parameter[0] = ffffc500651e5180 << _KPRCB
    Parameter[1] = 0000000000000000
    Parameter[2] = fffff800760e2a00
    Parameter[3] = (unknown)

Rich (BB code):
4: kd> dt _KPRCB -y IdleState ffffc500651e5180
win32k!_KPRCB
   +0x023 IdleState : 0x1 ''

Rich (BB code):
4: kd> u fffff800`7ac41dbb
nt!KiSearchForNewThreadOnProcessor+0x2eb:
fffff800`7ac41dbb 41c6868401000002 mov     byte ptr [r14+184h],2
fffff800`7ac41dc3 4584ff          test    r15b,r15b
fffff800`7ac41dc6 0f8539ffffff    jne     nt!KiSearchForNewThreadOnProcessor+0x235 (fffff800`7ac41d05)
fffff800`7ac41dcc 0fb64723        movzx   eax,byte ptr [rdi+23h] //Offset to the IdleState field in KPRCB
fffff800`7ac41dd0 488b8fc0000000  mov     rcx,qword ptr [rdi+0C0h]
fffff800`7ac41dd7 4488bf2b310000  mov     byte ptr [rdi+312Bh],r15b
fffff800`7ac41dde a801            test    al,1 // Lower 8-bits of EAX
fffff800`7ac41de0 0f8555f51e00    jne     nt!KiSearchForNewThreadOnProcessor+0x1ef86b (fffff800`7ae3133b) // test sets ZF to 0 if the result was 1, jne performs a conditional jump on ZF and jumps if ZF was 0.

4: kd> u fffff800`7ae3133b
nt!KiSearchForNewThreadOnProcessor+0x1ef86b:
fffff800`7ae3133b b921000000      mov     ecx,21h
fffff800`7ae31340 cd29            int     29h // This is the interrupt for Fast Fail exception
fffff800`7ae31342 4c858b40840000  test    qword ptr [rbx+8440h],r9
fffff800`7ae31349 0f84550de1ff    je      nt!KiSelectReadyThread+0x44 (fffff800`7ac420a4)
fffff800`7ae3134f 80fa07          cmp     dl,7
fffff800`7ae31352 4d0f45f3        cmovne  r14,r11
fffff800`7ae31356 e9490de1ff      jmp     nt!KiSelectReadyThread+0x44 (fffff800`7ac420a4)
fffff800`7ae3135b 807e2001        cmp     byte ptr [rsi+20h],1
 
I don't think I'm ever going to be able to drill down to that level of detail....😞

I can see you disassemble the nt!KiSearchForNewThreadOnProcessor+0x1ef86b function call, and that makes sense coming from nt!KiSearchForNewThreadOnProcessor+0x2eb, but in the call stack we get a call straight to the next instruction (nt!KiSearchForNewThreadOnProcessor+1ef870). The nt!KiSearchForNewThreadOnProcessor+0x2eb function doesn't call nt!KiSearchForNewThreadOnProcessor+0x1ef86b it uses a jump instruction, so we wouldn't see that on the call stack? Where then did the call to one instruction into nt!KiSearchForNewThreadOnProcessor+0x1ef86b (ie. at + 0x1ef870) come from?

For the OP, this is a CPU issue hardware then? And would disabling C-States affect that IdleState flag?
 
Code:
4: kd> knL
 # Child-SP          RetAddr               Call Site
00 ffffef80`f2141188 fffff800`7ae11aa9     nt!KeBugCheckEx
01 ffffef80`f2141190 fffff800`7ae12010     nt!KiBugCheckDispatch+0x69
02 ffffef80`f21412d0 fffff800`7ae0ff9d     nt!KiFastFailDispatch+0xd0
03 ffffef80`f21414b0 fffff800`7ae31340     nt!KiRaiseSecurityCheckFailure+0x31d
04 ffffef80`f2141640 fffff800`7ac4141c     nt!KiSearchForNewThreadOnProcessor+0x1ef870
05 ffffef80`f21416c0 fffff800`7ac4085f     nt!KiSwapThread+0x5ec
06 ffffef80`f2141770 fffff800`7ac17e43     nt!KiCommitThreadWait+0x14f
07 ffffef80`f2141810 fffff800`7ac17878     nt!KeRemoveQueueEx+0x263
08 ffffef80`f21418b0 fffff800`7b0e829d     nt!IoRemoveIoCompletion+0x98
09 ffffef80`f21419e0 fffff800`7ae11238     nt!NtRemoveIoCompletion+0x13d
0a ffffef80`f2141a90 00007ffc`0f6ed104     nt!KiSystemServiceCopyEnd+0x28
0b 00000079`a23ff6f8 00000000`00000000     0x00007ffc`0f6ed104

The 0x1ef870 part is just the offset from the beginning of the function nt!KiSearchForNewThreadOnProcessor, it works the same as the offsets in structures, which if we look at the trap frame:
Rich (BB code):
4: kd> .trap ffffef80f21414b0
NOTE: The trap frame does not contain all registers.
Some register values may be zeroed or incorrect.
rax=0000000000000001 rbx=0000000000000000 rcx=0000000000000021
rdx=0000000000000000 rsi=0000000000000000 rdi=0000000000000000
rip=fffff8007ae31340 rsp=ffffef80f2141640 rbp=0000000000000002
 r8=0000000000000007  r9=ffff8c0cf900e158 r10=ffff8c0cf5f52158
r11=ffffc500651e5180 r12=0000000000000000 r13=0000000000000000
r14=0000000000000000 r15=0000000000000000
iopl=0         nv up ei pl nz na pe nc
nt!KiSearchForNewThreadOnProcessor+0x1ef870:
fffff800`7ae31340 cd29            int     29h

It goes to that one particular instruction. The offset I was using goes the instruction just before the one where the trap was produced:

Rich (BB code):
4: kd> u nt!KiSearchForNewThreadOnProcessor+0x1ef86b
nt!KiSearchForNewThreadOnProcessor+0x1ef86b:
fffff800`7ae3133b b921000000      mov     ecx,21h // Starts here
fffff800`7ae31340 cd29            int     29h
fffff800`7ae31342 4c858b40840000  test    qword ptr [rbx+8440h],r9
fffff800`7ae31349 0f84550de1ff    je      nt!KiSelectReadyThread+0x44 (fffff800`7ac420a4)
fffff800`7ae3134f 80fa07          cmp     dl,7
fffff800`7ae31352 4d0f45f3        cmovne  r14,r11
fffff800`7ae31356 e9490de1ff      jmp     nt!KiSelectReadyThread+0x44 (fffff800`7ac420a4)
fffff800`7ae3135b 807e2001        cmp     byte ptr [rsi+20h],1

Rich (BB code):
4: kd> u nt!KiSearchForNewThreadOnProcessor+0x1ef870
nt!KiSearchForNewThreadOnProcessor+0x1ef870:
fffff800`7ae31340 cd29            int     29h // Starts here
fffff800`7ae31342 4c858b40840000  test    qword ptr [rbx+8440h],r9
fffff800`7ae31349 0f84550de1ff    je      nt!KiSelectReadyThread+0x44 (fffff800`7ac420a4)
fffff800`7ae3134f 80fa07          cmp     dl,7
fffff800`7ae31352 4d0f45f3        cmovne  r14,r11
fffff800`7ae31356 e9490de1ff      jmp     nt!KiSelectReadyThread+0x44 (fffff800`7ac420a4)
fffff800`7ae3135b 807e2001        cmp     byte ptr [rsi+20h],1
fffff800`7ae3135f 0f87fc0de1ff    ja      nt!KiSelectReadyThread+0x101 (fffff800`7ac42161)

The difference between the two is because the mov instruction takes 5 bytes, 3 bytes for the mov instruction and then 1 byte for the operand which is 0x21, it's a uchar data type. The register reference is also 1 byte.

This is a really handy tool for looking at instruction sizes: Online x86 and x64 Intel Instruction Assembler

You can just calculate the difference between the two offset sizes as well.

Rich (BB code):
4: kd> ? 0x1ef870 - 0x1ef86b
Evaluate expression: 5 = 00000000`00000005

The nt!KiSearchForNewThreadOnProcessor+0x2eb function doesn't call nt!KiSearchForNewThreadOnProcessor+0x1ef86b it uses a jump instruction, so we wouldn't see that on the call stack? Where then did the call to one instruction into nt!KiSearchForNewThreadOnProcessor+0x1ef86b (ie. at + 0x1ef870) come from?
A jmp instruction serves the same purpose as a call instruction, the only difference between the two is how they're evaluated by the processor. The reason why you're seeing the other offset (0x1ef870) on the call stack is because the int instruction causes a trap frame to be saved, the interrupt handler for 29h is then called which is nt!KiRaiseSecurityCheckFailure. The call stack contains the last call into that function.

I hope that makes sense?

For the OP, this is a CPU issue hardware then? And would disabling C-States affect that IdleState flag?
I had the same question and I've been trying to find some information on what the value for IdleState exactly refers to, unfortunately I haven't been able to find much at all, but I'm in agreement with you that is probably related to C-States and disabling them would be best troubleshooting step to undertake.
 
Sorry for the late reply, my machine no longer powers on, which turns out to be a faulty PSU. I've replaced one with a good quality one (Cooler Master V650 V2) and hopefully this should fix the issue for good. ;)
 

Has Sysnative Forums helped you? Please consider donating to help us support the site!

Back
Top